Fleet managers tracking fleet truck damage costs often focus on repair bills while missing larger financial impacts. A wildlife collision or debris strike creates cascading expenses affecting operations for weeks. Understanding the complete cost picture changes how operations directors evaluate protection equipment and makes the business case clear.
Truck downtime costs exceed repair bills in most scenarios. When a truck sits in the shop, it generates zero revenue while still incurring fixed costs, including financing, insurance, and registration. Fleet protection ROI calculations must account for these hidden expenses to accurately reflect true operational impact. The question isn’t whether truck damage prevention costs money, but whether the alternative costs more.
Direct Repair Costs: Just the Beginning
Front-end collision damage creates immediate repair expenses that vary by severity. Radiators, condensers, headlights, grilles, sensors, and bumpers require replacement. Modern commercial trucks incorporate expensive collision avoidance systems with vulnerable radar sensors and cameras mounted in front-end positions.
Minor incidents might cost several thousand dollars. Major collisions require radiator systems, cooling components, and structural work reaching tens of thousands. Parts availability affects both costs and timing.
Labor costs compound parts expenses through diagnosis, replacement, reassembly, and system recalibration. Complex modern trucks take longer to work on than older models. Collision avoidance systems require specialized recalibration after installation.
Downtime Revenue Loss: The Biggest Hidden Cost
Every shop day represents lost revenue that often exceeds repair costs. A truck generating consistent income suddenly produces nothing while maintaining costs, including financing, insurance, and registration. Calculate downtime impact by considering typical daily revenue multiplied by repair duration.
A repair requiring five business days represents a full work week of lost income. For trucks generating significant daily revenue, this loss quickly exceeds direct repair costs.
Operational disruption extends beyond the damaged truck. Fleet managers scramble to cover routes and deliveries. Other trucks take extra loads, creating driver overtime costs. Delayed deliveries potentially affect customer relationships.
Seasonal timing amplifies costs significantly. Agricultural fleets during harvest, retail operations during peak shipping, and construction during summer building months face particularly expensive downtime when every truck is needed most.
Hidden Operational Costs
When a truck goes down, operations must continue despite reduced capacity, creating costs that never appear on repair invoices.
Rental trucks provide temporary capacity but at a significant daily expense across multi-day repairs. Many operations require specialized equipment, and suitable rentals aren’t always available in the needed timeframes. The difference between internal operating costs and rental rates represents pure loss.
Expedited freight represents another hidden cost. When capacity drops, and commitments remain, operations turn to third-party carriers at premium rates. Route inefficiency creates fuel waste and driver overtime as remaining trucks cover additional territory.
Insurance Premium Impacts
Claims history affects insurance costs both immediately and over multiple policy years. Multiple incidents can trigger rate increases at renewal. Insurance companies evaluate fleet safety records when setting premiums, and frequent claims signal higher risk profiles.
Renewal negotiations reflect accumulated claim history. Underwriters reviewing fleets with multiple preventable collision claims price that risk into future coverage. Premium impacts persist across multiple policy years.
High deductibles reduce premiums but represent out-of-pocket costs. Frequent small claims might not reach deductible thresholds, meaning fleets absorb all costs directly.
Asset Depreciation and Resale Impact
Accident history affects truck resale value. Even after quality repairs, vehicles with damage history command lower prices than clean-history equivalents. Buyers discount prices when vehicle history reports show collision damage.
Fleet managers planning regular turnover must factor depreciation into total cost analysis. Collision damage accelerates depreciation beyond normal wear, reducing asset value recovered at disposition. Multiple incidents compound resale impact as buyers recognize patterns.
Administrative Burden
Collision incidents create administrative work that consumes staff time. Accident reports require documentation. Insurance claims need processing with detailed documentation and photos. Repairs demand coordination with body shops and suppliers. Vehicle status updates go to dispatch and customer service.
Safety investigations consume management time reviewing circumstances and implementing corrective actions. Claims processing involves multiple touchpoints, including damage assessment, estimates, insurer communication, repair authorization, and final payment. Complex claims can involve weeks of administrative effort across operations, safety, and accounting departments.
Prevention ROI Analysis
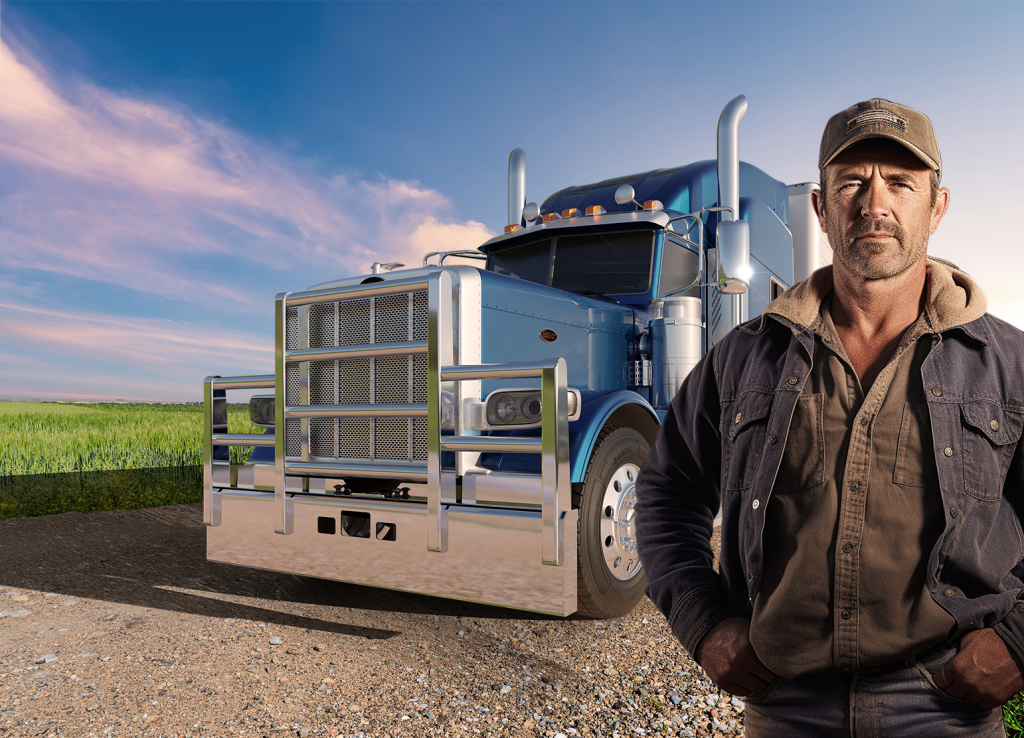
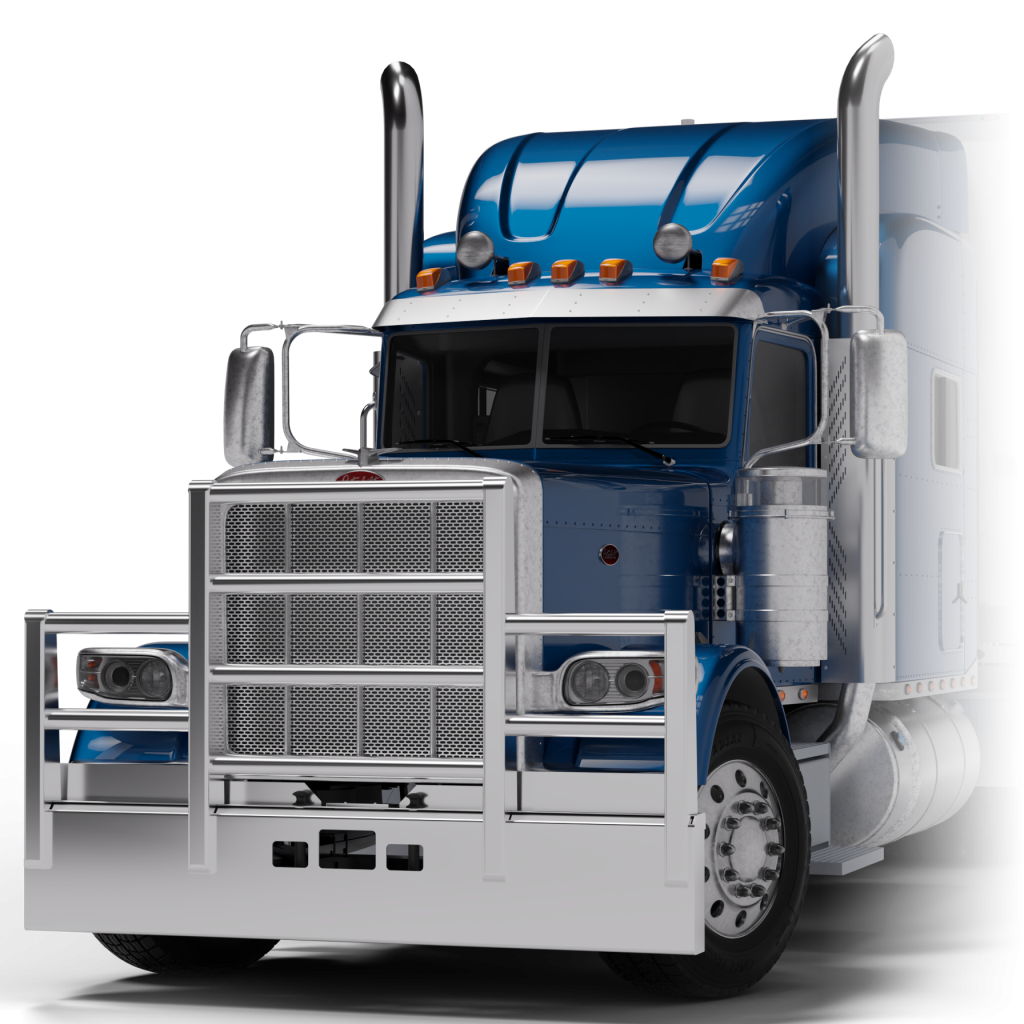
HERD protection equipment represents an investment in damage prevention. Semi truck grille guards provide focused protection. The HERD Grille Guard 300 and HERD Grille Guard 200 use 304 stainless steel construction to absorb impacts from wildlife and debris.
For maximum coverage, heavy-duty aluminum truck guards provide comprehensive protection. The Defender aluminum truck guard, HERD Texas truck guard, and Super Road Train offer varying protection levels. Guards are available in polished, satin, or black powder coat finishes with free freight on five or more units.
Warranty coverage includes 3-year guard warranties and 5-year Grip Latch warranties. ROI scenarios consider collision frequency, typical damage costs, downtime duration, and equipment expenses. Fleets in high-risk areas often see rapid ROI.
Making the Business Case
Building the business case requires a comprehensive cost analysis. Review historical damage data on incident frequency, repair costs, and downtime duration. Factor in rental costs, expedited shipping, insurance implications, and asset depreciation.
Compare total annual damage costs against protection equipment investment. Equipment preventing even a portion of expected incidents often delivers positive ROI within the first year. Regional HERD dealers assist with ROI calculations based on specific operational profiles.
Protect Your Fleet Investment
Understanding the complete financial impact of front-end damage transforms protection decisions. Costs extend beyond repair invoices, affecting operations, insurance, asset values, and administrative resources.
HERD protection equipment provides measurable damage prevention across diverse scenarios. From agricultural hauling to interstate freight, guards deliver ROI through reduced damage frequency.
Ready to analyze your fleet’s damage costs? Contact HERD to connect with dealers who can calculate protection ROI for your operations.
Frequently Asked Questions
How should fleet managers calculate true damage costs beyond repair bills?
Add direct repair expenses, downtime revenue loss (daily earnings times repair days), rental costs, expedited shipping fees, and administrative time. Include insurance deductibles and premium increases. For trucks approaching resale, account for depreciation from accident history. This comprehensive view reveals the actual financial impact.
What ROI timeframe should fleets expect from protection equipment?
ROI depends on collision frequency and damage severity. High-risk operations often see ROI within the first prevented incident. Moderate exposure typically achieves ROI within 12-24 months. Equipment continues providing value across its service life with 3-year guard warranties and 5-year Grip Latch warranties.
How does protection equipment affect insurance costs?
Protection demonstrates proactive risk management to insurers. Preventing collisions reduces claim frequency, helping maintain favorable rates. Lower claim history strengthens renewal positions. Primary insurance benefit comes from avoided claims and maintaining clean records supporting competitive rates.
Should fleets protect all trucks or prioritize high-risk routes?
Protect trucks on high-risk routes with significant wildlife exposure first. Analyze historical data to identify the highest incident frequency. Many fleets implement phased approaches, protecting high-risk operations, then expanding as ROI demonstrates value. Free freight on five or more units makes fleet-wide installation economical.
How do fleets justify protection equipment costs to executive management?
Present a comprehensive cost analysis showing total damage expenses, including hidden costs. Use historical data on repairs, downtime, and disruption. Calculate annual damage costs and compare against equipment investment. Show ROI projections based on prevented incidents. HERD dealers provide ROI calculations tailored to operational profiles.