Fleet owners evaluating roi of semi truck grille guard investments need clear frameworks for comparing protection equipment costs against potential incident expenses. This guide provides cost comparison methodologies for analyzing protection equipment investments.
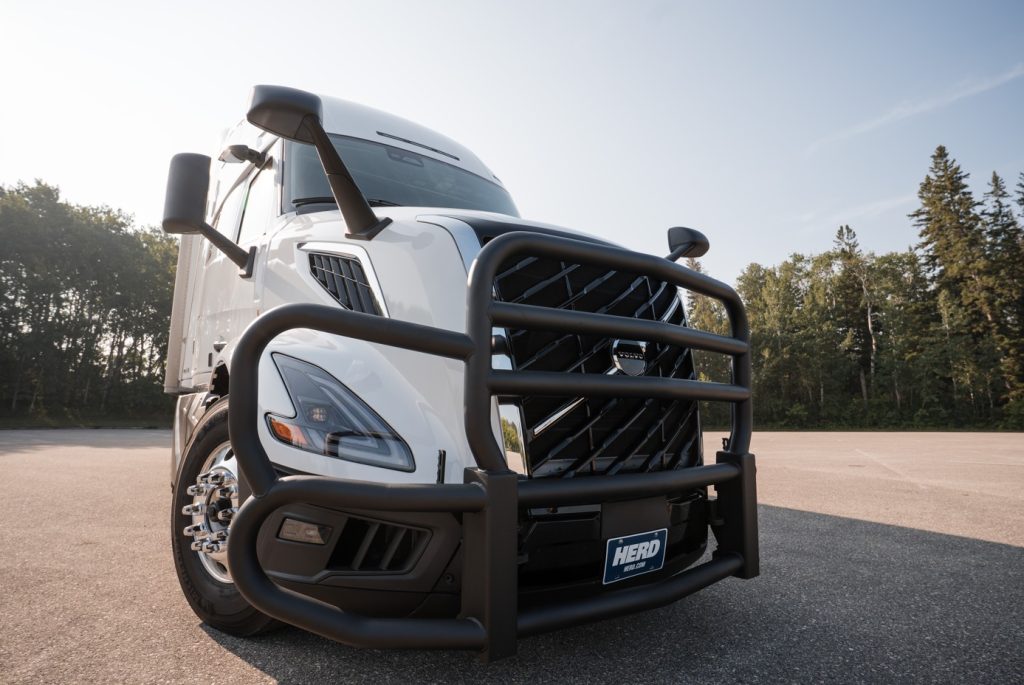
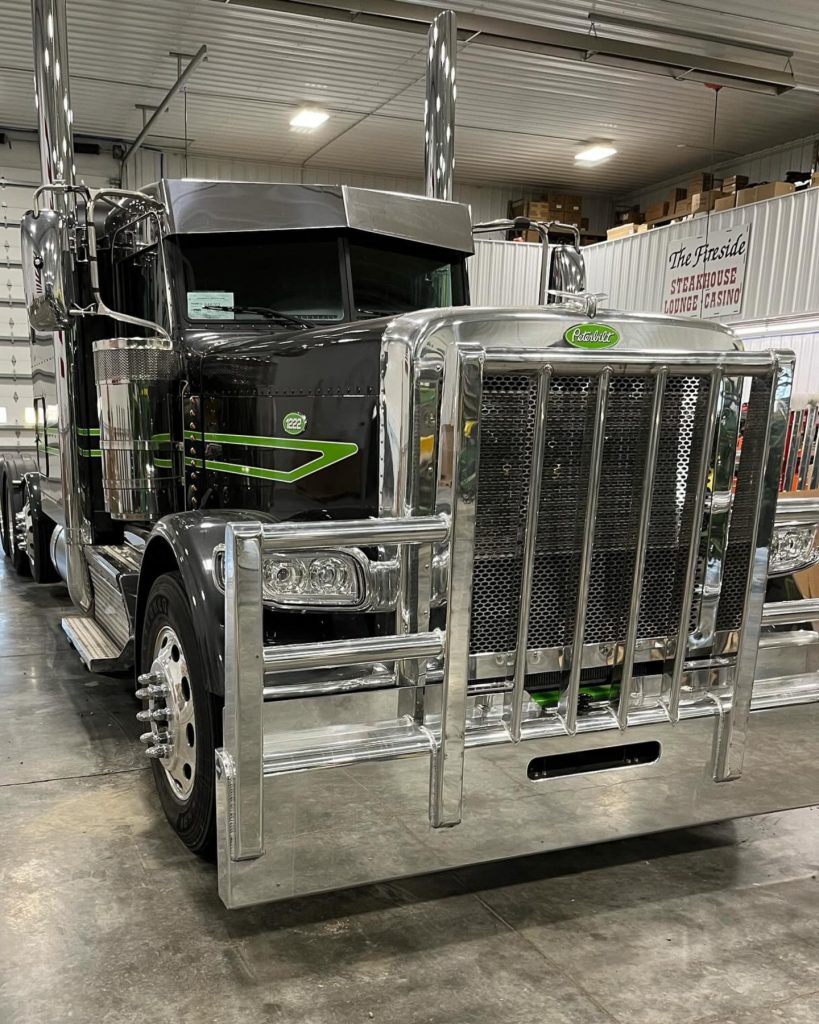
HERD manufactures grille guards for commercial trucks.
The Cost of Unprotected Fleet Assets
Operating semi trucks without front-end protection exposes your fleet to financial risks from road hazards and wildlife encounters. A single deer strike can generate thousands in repair costs plus days of vehicle downtime.
Front-end damage incidents generate multiple cost categories, including direct repair expenses, vehicle downtime, lost revenue opportunities, and operational disruptions. Beyond obvious repair bills, incidents create administrative burdens and potential customer service disruptions.
Individual incidents may seem manageable, but costs accumulate across fleets over time. Multiple incidents across a fleet generate substantial annual expenses that protection equipment investments could reduce.
Incident Cost Analysis Framework
Examine historical front-end damage incidents from your fleet. Document incident frequency, repair costs, and downtime duration. Break down costs into specific categories and calculate the average cost per incident. Frequency combined with average cost shows the annual incident expense.
Protection Equipment Investment Analysis
Protection equipment investments include equipment acquisition costs and implementation expenses. Consider equipment lifespan when calculating annual investment cost. Spreading acquisition cost across equipment service life provides annual cost figures comparable to annual incident costs.
You can deploy protection equipment fleet-wide or target specific vehicles based on risk exposure. Large fleets can implement equipment in phases, targeting the highest-risk vehicles first.
Cost Comparison Methodology
Calculate annual protection equipment cost by dividing the total investment by the expected equipment lifespan. Compare this annual protection cost against annual incident costs from your historical data.
Determine how many incidents of protection equipment must be prevented to recover investment costs. Divide the total investment by the average incident cost to find the breakeven incident count.
Calculate the years until the protection equipment investment recovers through prevented incident costs. Divide the total investment by the annual incident cost savings to determine the payback period.
Test how changing assumptions affects cost comparisons. Sensitivity analysis reveals how robust your investment case is across different scenarios.
Incident Cost Variables
Modern semi trucks include front-end systems where damage generates higher repair costs. Damaged components often require complete replacement. Repair labor costs vary by location and facility.
Time required for repairs affects downtime costs. Component availability affects repair timelines. Longer parts waiting periods extend downtime and increase associated costs.
Downtime Cost Calculation
Calculate daily revenue generation for vehicles in your fleet. Multiply daily revenue by downtime days to quantify revenue loss from incidents.
Vehicle downtime while trucks sit in repair facilities represents a significant incident cost beyond direct repair expenses.
Route Risk Assessment
Different routes present different risk profiles affecting protection equipment ROI. Routes through rural areas with significant wildlife populations create different risk profiles than urban routes.
Incident frequency often varies seasonally. Wildlife encounters often concentrate during dawn and dusk hours. Route-specific factors affect annual incident frequency calculations.
Fleet Size Considerations
Smaller fleets evaluate protection equipment per-vehicle, with each vehicle representing a larger percentage of capacity. Larger fleets analyze protection equipment across entire populations with targeted deployment on the highest-risk vehicles.
Building Your Business Case
Build business cases on solid data showing historical incident costs and frequencies. Use conservative assumptions in ROI projections showing positive returns even under pessimistic scenarios.
Create visual comparisons showing annual incident costs versus annual protection equipment costs. Address potential risks affecting ROI achievement.
Long-Term Value and Monitoring
Protection equipment helps preserve vehicle condition and contributes to fleet operational reliability. Track actual results after implementation by continuing to document incidents and costs. Compare actual results against historical baselines to validate projections.
Making the Investment Decision
Protection equipment investments should demonstrate favorable cost comparisons. Annual protection costs substantially lower than annual incident costs suggest solid investments.
Consider your fleet’s actual risk exposure. High-mileage operations through areas with significant wildlife populations face different risk profiles than urban delivery fleets.
Practical decisions account for current capital budget constraints. Evaluate protection equipment investments against other fleet capital needs.
Protect Your Fleet Investment
Your semi truck fleet represents substantial capital investment. Protection equipment helps preserve assets against road hazards and wildlife encounters, creating unexpected costs.
For information about protection equipment options, contact HERD to discuss solutions relevant to your fleet needs. Explore truck guard options suited to your requirements.
Frequently Asked Questions
How do I calculate ROI for semi truck grille guards?
Calculate ROI by comparing annual protection equipment costs against annual incident costs in your fleet. Review historical front-end damage incidents to establish baseline costs and frequency. Calculate the average cost per incident, including repairs and downtime. Multiply average cost by annual incident frequency to determine total annual incident expense. Calculate annual protection equipment cost by dividing total investment by expected equipment lifespan. Compare annual protection cost against annual incident costs. Calculate payback period by dividing total investment by annual incident cost savings to see how quickly you recover the initial investment.
What costs should I include when analyzing incident expenses?
Include all costs generated by front-end damage incidents. Start with direct repair costs including parts and labor charges. Add vehicle downtime costs by calculating daily revenue loss multiplied by repair duration. Consider administrative costs for processing repairs. Include any customer service costs from delivery disruptions. For accurate analysis, track these cost categories across historical incidents to establish realistic baseline costs. Complete cost accounting ensures your ROI calculations reflect the true financial impact of incidents versus protection equipment investments.
How many incidents must protection equipment prevent to justify investment?
Calculate the breakeven incident count by dividing total protection equipment investment by average incident cost. This shows how many incidents must be prevented to recover investment. Compare the breakeven count against your historical incident frequency. If your fleet experiences more incidents annually than the breakeven count, protection equipment should generate positive ROI. This breakeven analysis provides clear thresholds for evaluating investment merit based on your specific fleet data.
Should I deploy protection equipment fleet-wide or target specific vehicles?
Deployment strategy depends on fleet size, risk exposure variation, and capital availability. Targeted deployment focuses initial investment on highest-risk vehicles based on routes, mileage, or historical incident patterns. This approach demonstrates ROI with limited capital. Fleet-wide deployment provides uniform protection but requires a larger initial capital commitment. Many larger fleets use phased approaches, starting with high-risk vehicles and then expanding based on demonstrated results. Consider your specific risk profile and budget constraints when determining deployment strategy.
How long does protection equipment investment typically take to pay back?
Payback periods vary based on incident frequency, average incident costs, and protection equipment investment levels in your specific fleet. Calculate payback by dividing total investment by annual incident cost savings. Fleets with frequent incidents and high average repair costs typically see faster payback than operations with occasional incidents. Run sensitivity analysis using different incident rate and cost assumptions to understand payback ranges for your situation. Compare calculated payback periods against your organization’s capital investment criteria to determine acceptability.